

The following content is sponsored by Burgex Inc.
Mapped: Crushed Stone, Sand, and Gravel Production in the U.S.
Crushed stone, sand, gravel, and other construction aggregates account for half of the industrial minerals produced in the United States.
These materials represent a $29 billion per year business in the country.
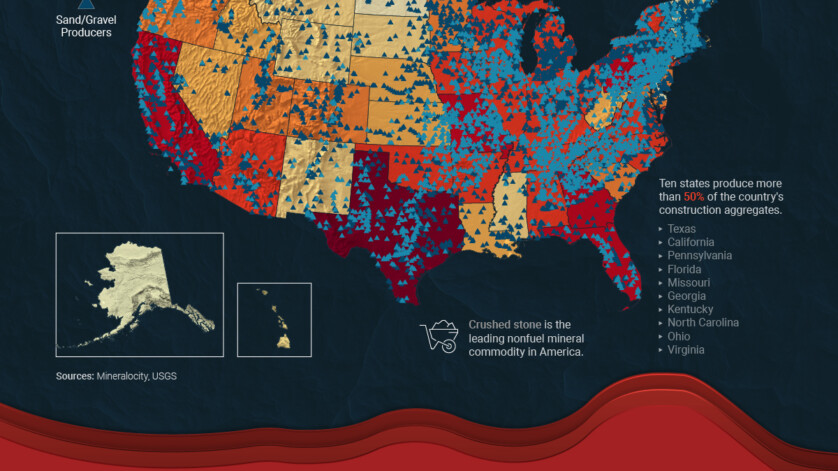
The map above from our sponsor Burgex uses data from Mineralocity to show where aggregates are produced in America.
What Are Aggregate Minerals?
Aggregates are a variety of materials produced in pits or quarries, including sands, gravel, and crushed stone.
They are usually used in construction, with the largest proportion used to manufacture concrete.
Sand: The world’s most consumed raw material after water and the primary substance used in construction.
Gravel: It occurs naturally but it is also produced. Almost half of all gravel production is used as an aggregate for concrete.
Crushed Stone: Used mostly as an aggregate for road construction and maintenance. It is the leading nonfuel mineral commodity (by value of production) in America.
On average, each person in America drives demand for over 10,000 lbs of stone and around 7,000 lbs of sand and gravel per year.
Aggregate Production by State
Ten states produce more than 50% of the country’s construction aggregates.
The five leading States are, in descending order of total output: Texas, California, Florida, Ohio, and Pennsylvania.
StateCrushed Stone Sold in 2021 (Thousand metric tons) Construction Sand and Gravel Sold in 2021 (Thousand metric tons)
Texas170,00095,200
California 51,000114,000
Florida94,90021,700
Ohio69,90035,200
Pennsylvania87,7006,830
Over 7,000 U.S. commercial aggregate companies are currently operating.
Growing urban areas across the U.S. and the rise in high-rise structures, which use concrete extensively, are expected to continue boosting demand for aggregates.
Additionally, maintenance of aging infrastructure across the country is expected to support the demand. In 2011, a study by the United States Geological Survey concluded that one-third of America’s major roads were in poor or mediocre condition, and over one-quarter of the bridges were either structurally deficient or functionally obsolete.
In this scenario, the aggregates market in the U.S. is expected to grow by 263.53 million tons from 2021 to 2026, at an annual average growth rate of over 2.5%.
Mineralocity utilizes the latest in population trends, pricing, and construction projects to determine the very best locations for quarry development and construction aggregate product distribution. Click here to learn more about Mineralocity Aggregates.
The post Mapped: Crushed Stone, Sand, and Gravel Production in the U.S. appeared first on Elements by Visual Capitalist.
 Latest News
- VIDEO.I.NG = 2 Live Crew – Banned In The U.S.A .This song, suddenly feeling very relevant. October 27, 2025
- America: Country in the Mirror – Talking About The Americans in the Mirror . We are what we eat indeed and Certainly What or Who we VOTE For ! October 27, 2025
- Michael Jackson, Olodum and the Yoruba Connection ! October 27, 2025